Getting started
The Crops in silico model composer is based on the popular JupyterLab
web-based interactive analysis and development environment. JupyterLab
provides a complete development environment for the creation and execution
of models using the cis_interface integration framework. The model
composer is a JupyterLab plugin that supports a visual-programming approach
to model composition.
Logging in
To access the web service, go to https://cropsinsilico.ndslabs.org. The CiS model composer uses GitHub for authentication. You will be prompted to sign-in via GitHub and to authorize CiS to access information about you. username.
Click on the “Sign in with GitHub” button:
 Login
Login
Enter your GitHub credentials or create an account, if necessary:
 Github login
If prompted, authorize “Crops in silico” to access your profile information:
 Authorize CiS
Starting JupyterLab
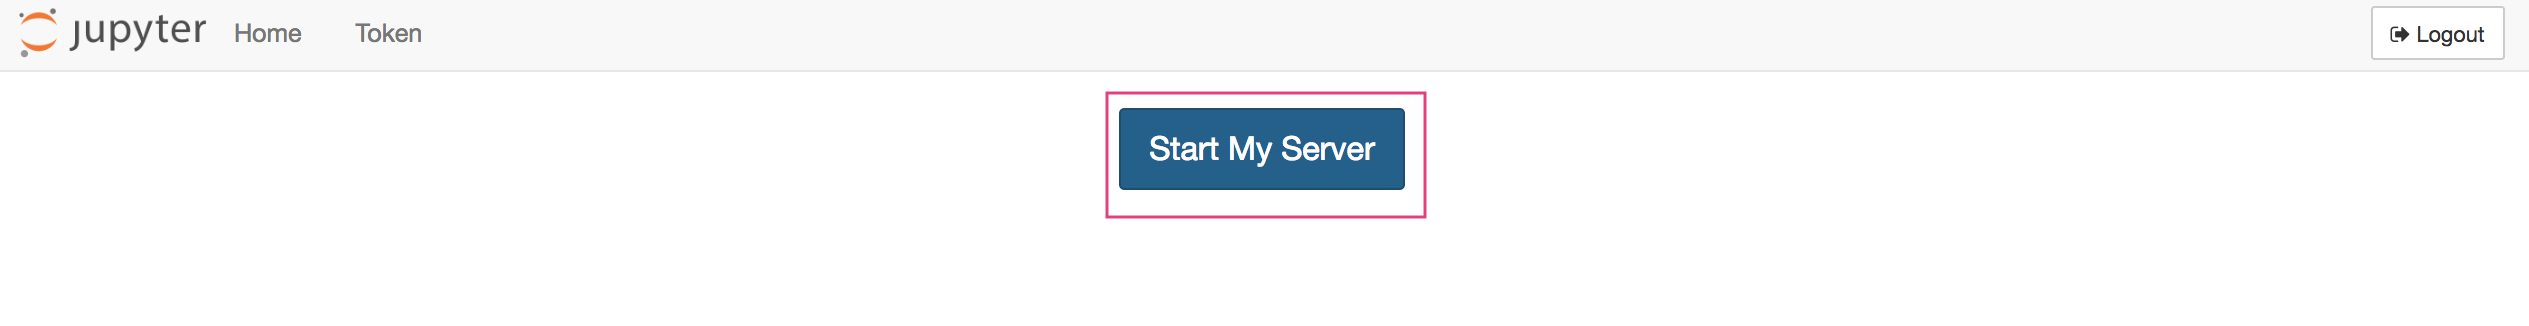
Once logged in, you will be able to start your JupyterLab instance. Select “Start My Server”:
 Start server
Launching the Model Composer
Once started, you will see the JupyterLab launcher. This JupyterLab environment
is a complete development environment for use with the cis_interface
framework. You can create notebooks, execute commands from the terminal, or
launch the model composer. Select the “Model Composer” icon:
 JupyterLab launcher
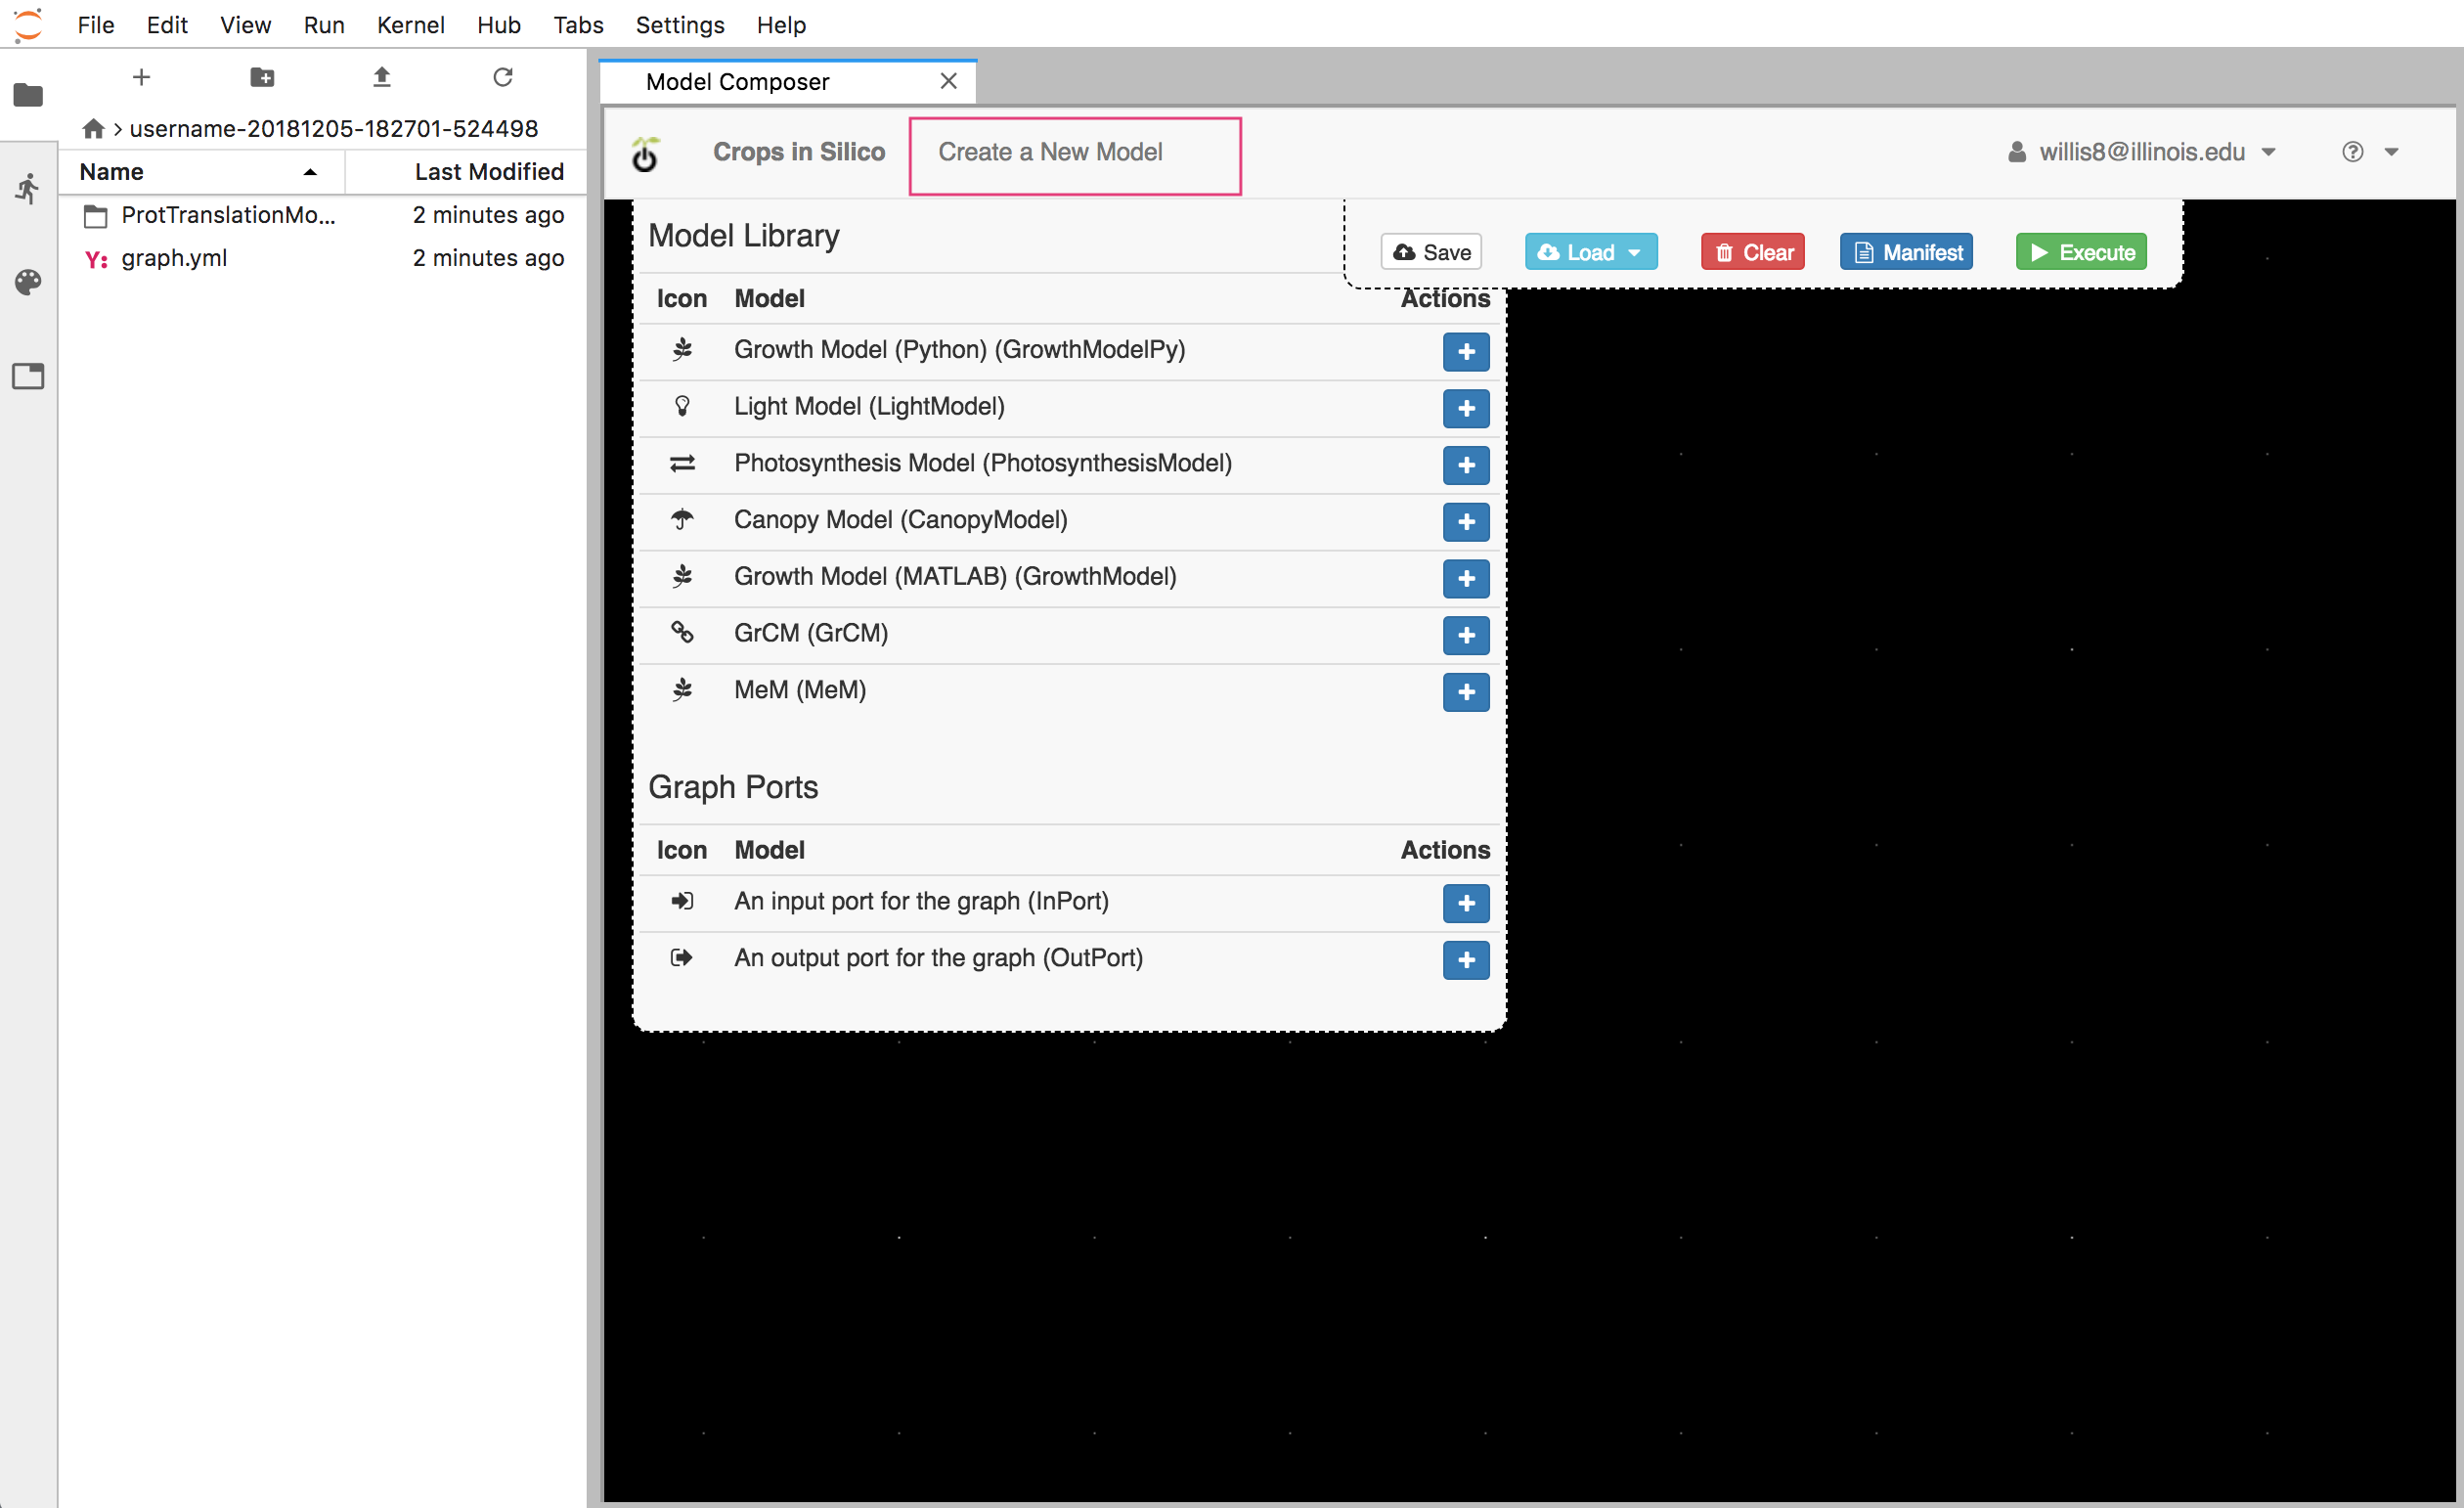
Loading an Existing Model Graph
The model composer allows to to create and use models from the model library to
compose execution graphs. Select the “Load” button to load the “GrCM” model:
and
 Model composer
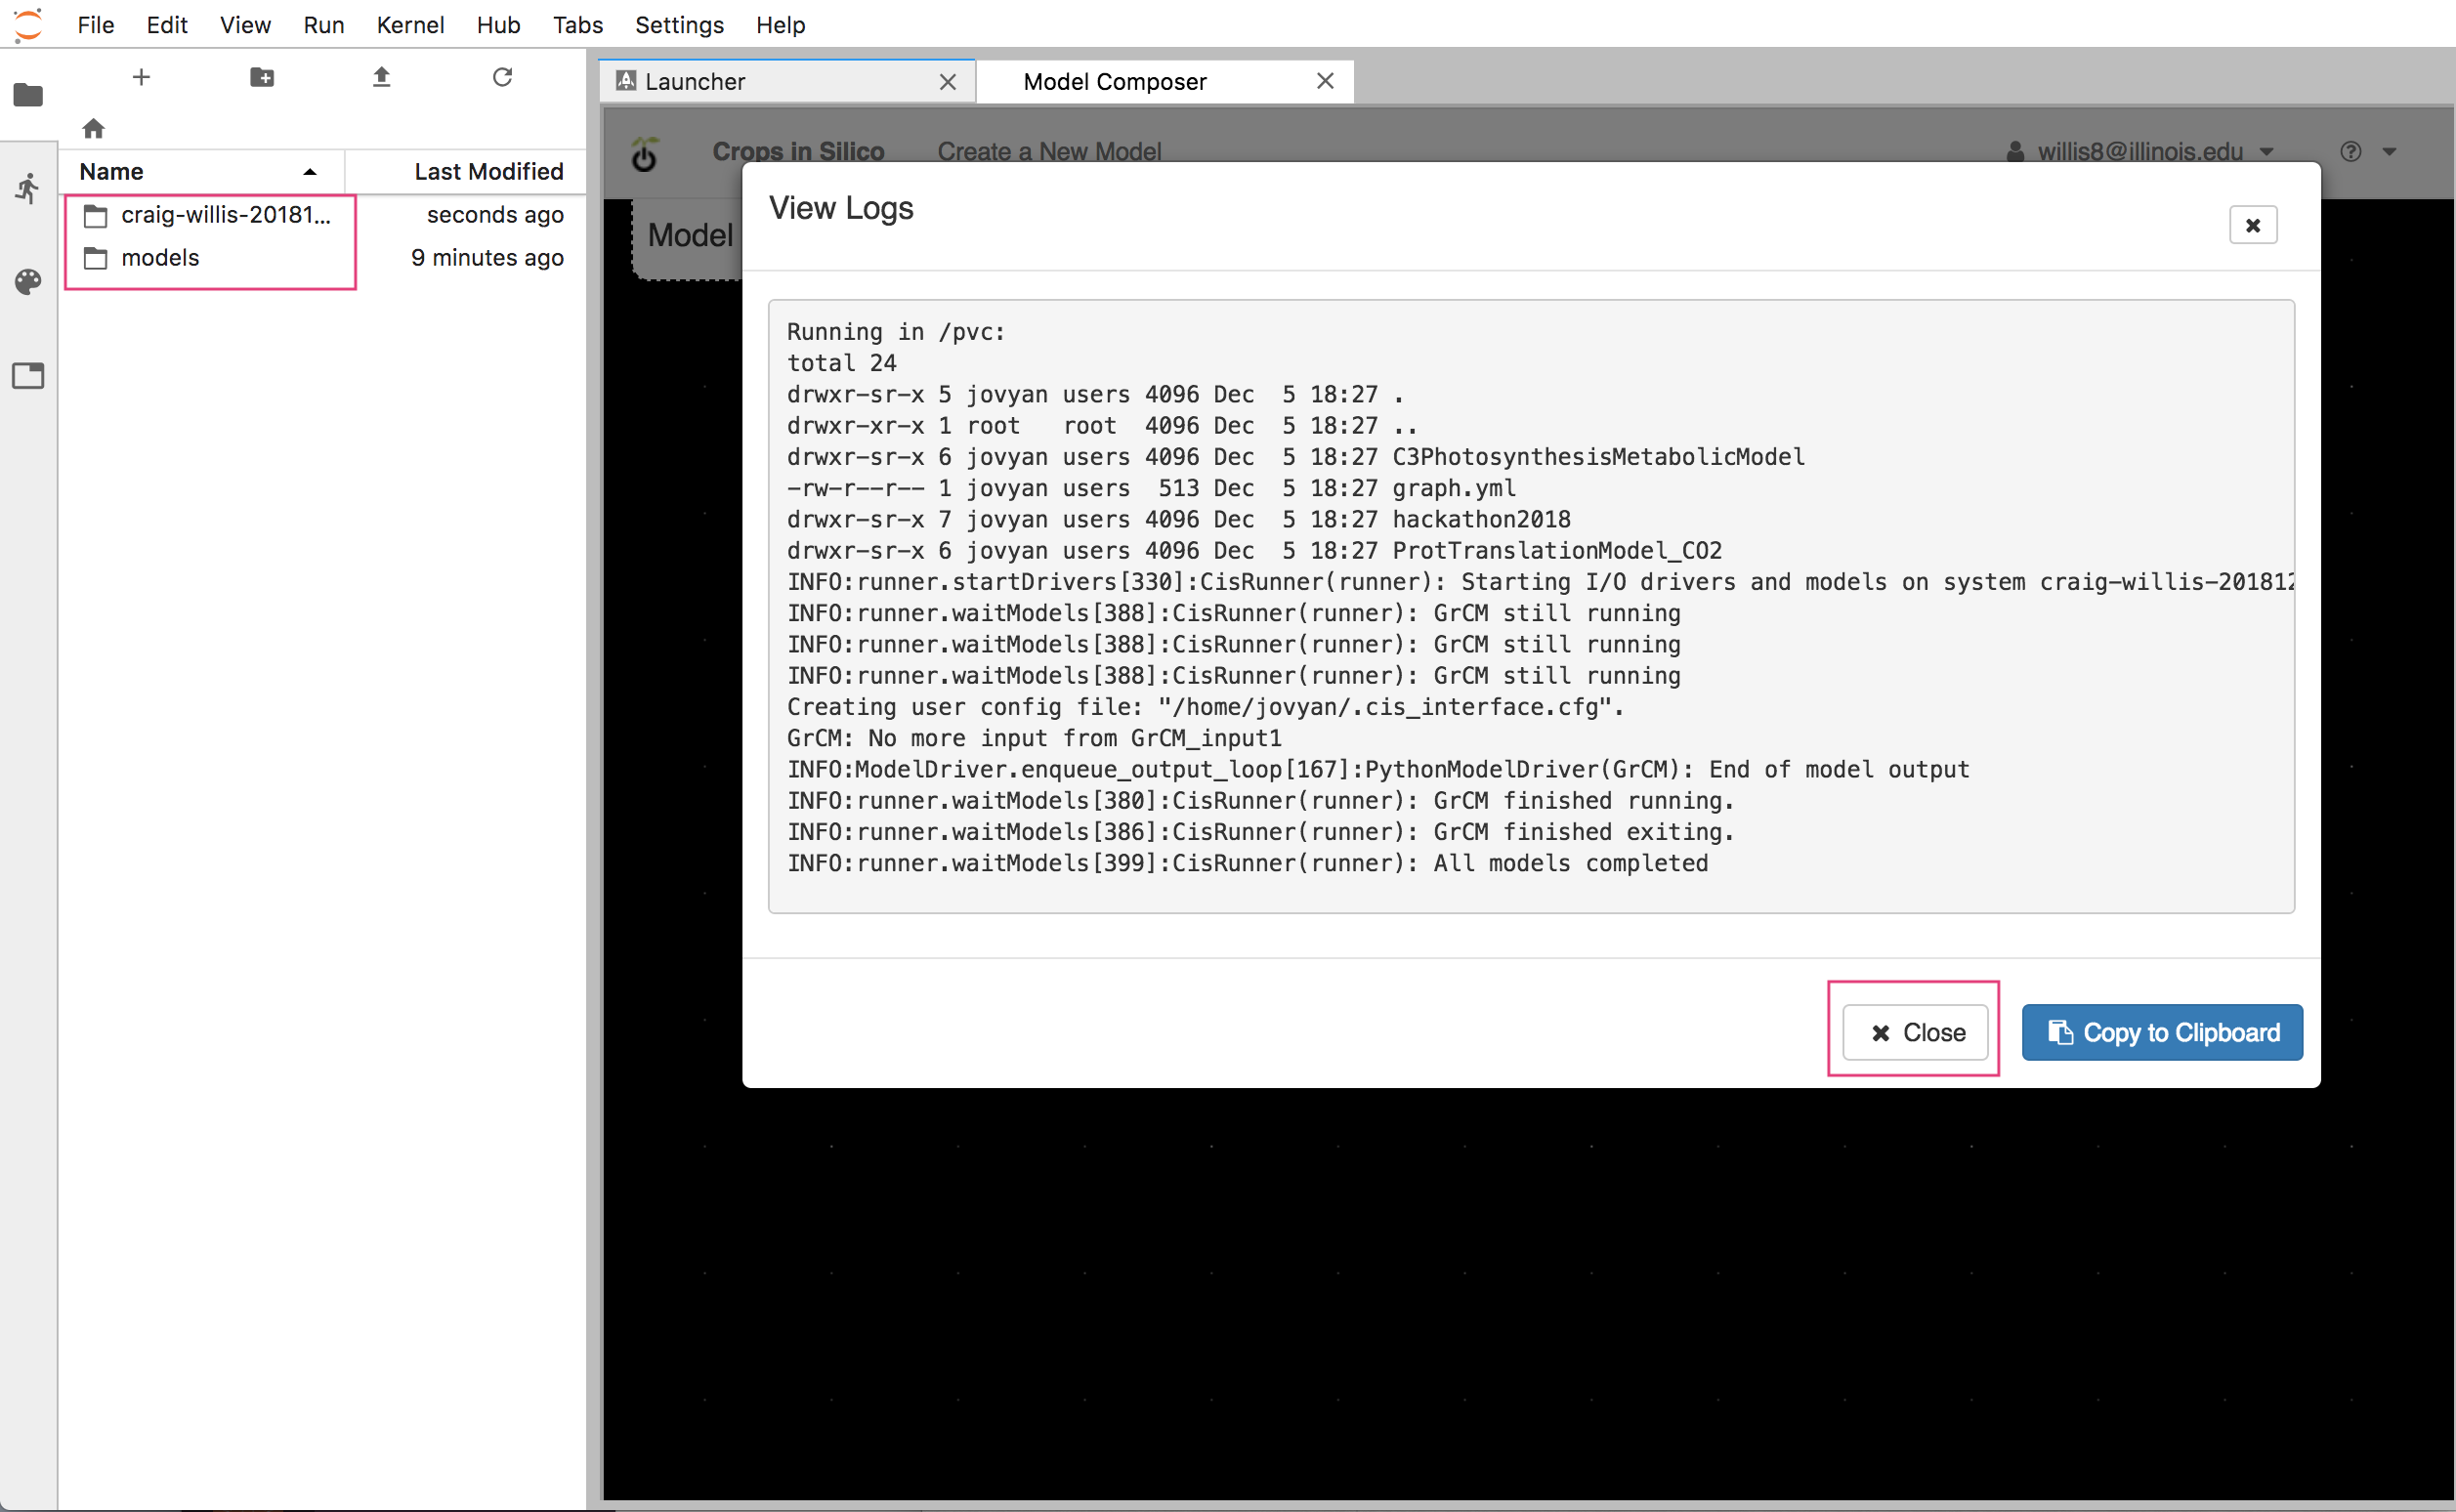
Executing the Graph
Select “Execute” to run the model. Model output will be displayed on screen and
written to an model output directory for further exploration:
 Model logs
Viewing Execution Output
The model output directory contains the graph, model source, inputs and outputs used during execution:
 Model output
Using the Model Library
The model library lists all official models approved by the community as well as any private models you have developed and added to the system. You can use the library to compose new graphs using this user interface:
 Model libraryl
Next step
For more detailed usage information, please see the User Guide.