User Guide
Welcome to the User’s Guide for the Crops in silico Model Composer UI. The purpose of this document is to describe the usage of the User Interface. If any of the steps described in this document are unclear or confusing, please direct your questions to Crops in silico Support
To assist the Support Team in their investigation, please be sure to include the browser type/version and operating system that you were using when the troublesome behavior was encountered.
Table of Contents
Orientation
 Orientaton
The Model Composer UI consists of several smaller components:
- Navbar
- Canvas (aka “The Graph”)
The Navbar runs along the top of the UI and contains the Crops in silico brand name and logo. On the left side, you will find a link to submit a new model. On the right side, you will also find the Log In button and a Help dropdown which contains links to this user guide, the developer’s guide, and the documentation for the cisrun CLI tool.
The Canvas is the grid with the black background in the center of the screen. This displays the current state of the graph that the user is working on.
In front of the Canvas, there are also a few helpful floating windows:
- Model Library (aka “Palette”)
- Button Bar
- Context Menu + Edit Sidebar
The Model Library starts collapsed, and can be found on the top-left of the canvas. This consists of a simple table listing of the existing models that the system knows about. Here we can also add InPorts and OutPorts to our graph. Simply click the Add (+) button and the new node will appear in the Canvas. If the node appears off-screen, you can easily find it by pressing the F key to focus on the entire graph. For models that you have created, here you can also find the option to delete them (see Creating a New Model).
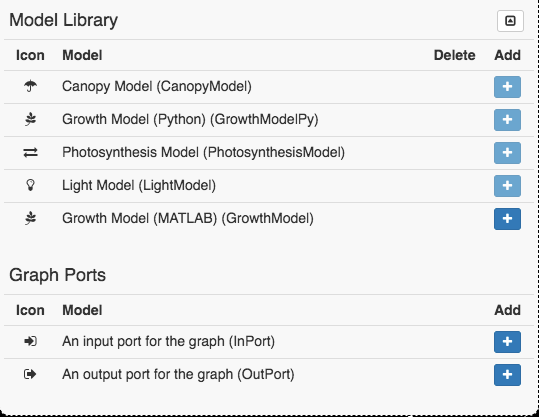 Expanded Model Palette
The Button Bar runs along the top-right of the canvas. It contains actions such as Save, Load, Clear, and Generate Manifest. Save will store the state of your current graph to the database, while Load will import a given state from the database. Clear will remove all nodes and edges from the current canvas, but does not affect graphs that have been stored in the database. Generate Manifest will convert the current graph on the canvas to the format that is required by the cisrun CLI.
The Context Menu appears when an entity in the canvas is right-clicked. It appears as a round menu that centers on where the mouse click occurred. Edit and Delete are offered the only actions offered, and only when right-clicking on Edges or Nodes (including InPorts and OutPorts).
If Edit is chosen, the Edit Sidebar will be displayed on the right edge of the canvas. The sidebar allows you to edit the metadata of the entity you have selected. This sidebar will also appear when adding an InPort or OutPort to specify the source/destination of the data.
Canvas Controls
The Canvas accepts a few mouse/keyboard inputs:
F: Auto-focus the graph so that you can see all elementsLeft-click: Select a port on a nodeLeft-click (hold): Drag a node around the canvasRight-click: Display the context-menu for the clicked graph element
Loading an Example Graph
The Button Bar at the top-right should offer a Load button. Clicking on this button will expand a dropdown list of all saved graphs and examples currently accessible. Choosing one of these examples will load its contents into your Canvas, allowing you to visualize and edit the graph before generating a manifest for use with cisrun.
Adding a Node
The Model Library on the left side offers an “Add” button beside each model. Click this button to add a new node to the canvas representing the model you’ve chosen. Once added, you can left-click this node and hold to drag it around the canvas. On the new node, you should see grey dots on the left/right sides - these are the inputs (left side) and outputs (right side) that this model accepts.
For more details, see the documentation for Model file input/output
About the Bounding Box
While dragging, you may notice a lighter gray circle around the dragged node. This is the “bounding box” that indicates valid areas where your node can be dragged - as your node moves the bounding box moves with it! This behavior is meant to prevent you from dragging a node so fast that the mouse cursor exits the node before the “drag” event is picked up.
Adding an Edge
To create an edge, simply click on an output on a model - this should display a floating edge that ends at your cursor. Then, select an input on another model. You can also choose an input first and connect that to an output.
NOTE: Inputs can only be connected to outputs and vice versa. An input cannot be connected to another input. An output cannot be connected with another output.
For more details, see the documentation for Model-to-model communication
Adding an InPort / OutPort
While each node has its own set of inputs and outputs, the entire graph likely will need InPorts/OutPorts of its own. The Model Palette at the left of the view offers buttons to add these InPorts and OutPorts.
Logging In
For users who simply wish to build new graphs from our existing sets of models, we do not require them to create an account or log into the system. Anyone who wishes to Create a New Model or Save a Composed Graph to the database, however, will need to sign up for an account. This is simply to track which users created which models, to avoid showing unvetted or defunct options to all users.
To begin the login process, click Log In at the top-right in the Navbar:
 OAuth Start
You will then be prompted for your GitHub account credentials. If you do not already have a GitHub account, you can sign up for one for free on GitHub.com
 OAuth Authentication
After signing in, you will be asked to Authorize the Crops in silico Platform to access your GitHub account information. We only examine your user profile information and use it to create al inked account in our system.
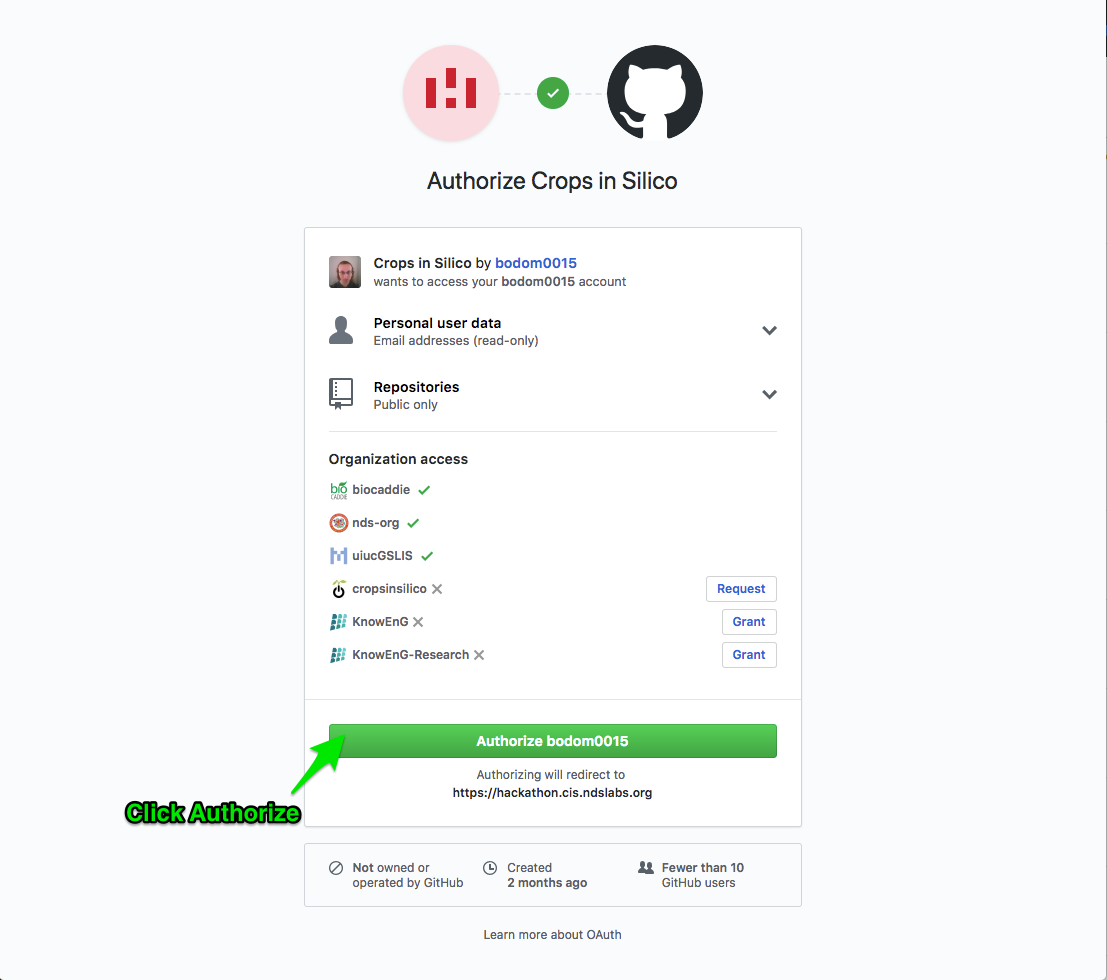 OAuth Authorization
Click “Authorize” to be redirected the Crops in silico application. You are now logged in as your GitHub user, and should see a couple of new buttons have appeared in the User Interface:
- Save Graph
- Submit a New Model
 OAuth Authorized
Saving a Composed Graph
After logging in, the Button Bar will include a Save button. Clicking this button will offer you a prompt to name this graph. If a valid name is entered, the graph will be saved to the database.
Loading a Previously-Saved Graph
After a graph has been saved, it should appear in the Load dropdown on the Button Bar. Choosing a previously-saved graph will load its contents into the Canvas.
NOTE: In order to facilitate composing different models and examples, Load does not Clear your existing graph state.
Deleting a Previously-Saved Graph
For graphs that you have saved, you should see a Delete button beside them. Simply click this button to remove the saved graph from the database.
Creating a New Model
Do you have a new model that you would like to contribute? After logging in, the Navbar offers a link that will allow you to submit your own custom model metadata. Simply Log In at the top-right, then click Submit a New Model at the top-left. A pop-up should appear allowing you to enter all necessary metadata fields of you model. Once created, your model appears in your personal catalog for testing and debugging.
Deleting a Model
If you have created a model that you would like to remove, you should see a Delete button listed on the Model Palette once when it is expanded. Click the search icon to expand the Model Palette. You should see a red Delete button beside any unofficial specs that you have created.
NOTE: Once a model or graph has been officially submitted, it cannot be deleted
Official Submission
When you are satisfied with the working state of your model or graph, you can submit it to our official catalog as an issue or pull request to the cis-specs repository. Here it will go through a peer review process where it will be testing and vetted. If it passes the review, it will be accepted into our official catalog, where all users will be able to consume and use the new model.
We are working to automate this submission process further, and we thank you for your patience while we determine the best course of action.